
- Why You Must Read Server Logs on UK VPS Daily in 2026
- How journalctl Works on Modern Linux VPS
- How to Read Server Logs from NGINX Access and Error Files
- How to Read Server Logs from PM2 Node.js Applications
- How to Debug systemd Service Failures with journalctl
- How to Read Server Logs Filtered by Time and Priority
- Log Rotation and Retention on UK VPS
- Best Practices for Structured Logging in Node.js and WordPress
- Centralized Log Management for Multi-VPS Setups
- Monitoring UK VPS Logs with Prometheus and Alertmanager
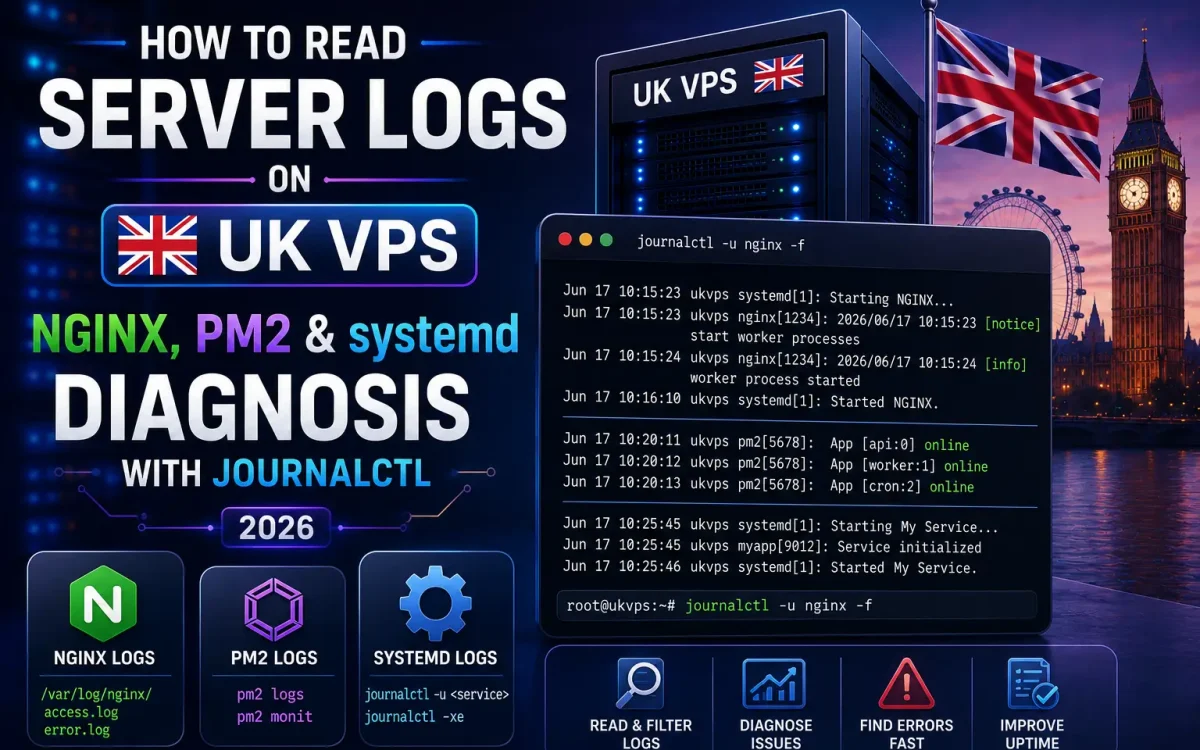
Server logs UK VPS diagnosis is the fastest path to solving downtime, slow responses, and mysterious 502 errors on production Linux hosting in 2026. Every UK VPS running WordPress, Node.js, or a Docker stack writes structured events to journalctl, NGINX access logs, and PM2’s application logs — but most sysadmins never learn to read them properly. This guide shows how to read server logs on UK VPS using journalctl, diagnose NGINX and PM2 failures within minutes, and set up log rotation that keeps your UK Speed premium network VPS lean and auditable.
Why You Must Read Server Logs on UK VPS Daily in 2026
Every production incident on a UK VPS leaves a trail in the logs — a failed database connection, an OOM kill, a certificate renewal error, or a brute-force login attempt. Sysadmins who read server logs proactively catch problems hours before they escalate; those who react only to alerts spend nights chasing symptoms. In 2026, with WordPress, Node.js APIs, and Docker containers all running on a single UK VPS, the ability to read server logs quickly is the single most valuable operational skill. Modern Linux distributions unify log collection through systemd’s journal, which makes it possible to read server logs faster and more consistently than the fragmented file-based approach of earlier decades.
How journalctl Works on Modern Linux VPS
journalctl is the query interface into systemd’s binary journal, which captures every log message from every systemd-managed service into a single, indexed, structured store. Run journalctl -u nginx to see only NGINX events, journalctl -p err to filter by error priority, and journalctl -f to follow logs live like tail -f. Because the journal indexes by unit, priority, and timestamp, queries return instantly even on VPS with gigabytes of history. Persistent logs survive reboots when /var/log/journal exists — a one-line fix that every UK VPS should apply from day one.
How to Read Server Logs from NGINX Access and Error Files
NGINX writes two log files at /var/log/nginx/: access.log for every HTTP request and error.log for configuration issues, upstream failures, and rate-limit rejections. To read server logs from NGINX in real time, tail the access log with tail -f /var/log/nginx/access.log and filter for 5xx errors using grep ' 5[0-9][0-9] '. For deeper triage, use awk '{print $9}' access.log | sort | uniq -c | sort -rn to count status codes at a glance. The error log is where slow upstream WordPress responses show as upstream timed out — a signal to profile PHP-FPM or add sub-100ms TTFB optimizations.
How to Read Server Logs from PM2 Node.js Applications
PM2 keeps per-process logs at ~/.pm2/logs/ with separate -out.log and -error.log files. Run pm2 logs to stream all apps live, pm2 logs api-server to focus on one, and pm2 logs --lines 200 to review recent history. When an app restarts unexpectedly, pm2 status shows the restart counter — if it climbs, the process is crash-looping. Combine PM2 logs with journalctl by adding --log flags: pm2 start app.js --log /var/log/api.log. This keeps Node.js output in a location journalctl can index via a systemd service wrapper.
How to Debug systemd Service Failures with journalctl
When a systemd service fails to start, systemctl status my-service shows the last few log lines, but journalctl -u my-service -e shows the full history end-first. Add -p err..alert to filter for errors and alerts only. For failed startup, check --since "10 minutes ago" to see the exact reason: missing dependencies, permission errors, or unreachable databases. If a service loops between activating and failed, journalctl -u my-service -f during the restart cycle exposes the root cause line by line — usually a config typo, missing env variable, or absent port binding.
How to Read Server Logs Filtered by Time and Priority
The four query flags every UK VPS admin memorises to read server logs efficiently: -u nginx.service (unit filter), --since "2 hours ago" (time filter), -p warning (priority filter), and -o json-pretty (structured output). Combine them: journalctl -u nginx --since "1 hour ago" -p warning returns exactly the NGINX warnings from the last hour, nothing else. For post-mortem analysis after an incident, export a slice with journalctl --since "2026-07-14 09:00" --until "2026-07-14 10:00" > incident.log — a compact, timestamped snapshot ready for offline review or sharing with a support engineer.
Log Rotation and Retention on UK VPS
Uncontrolled logs eat disk space fast. NGINX ships with logrotate configured for daily rotation and 14-day retention at /etc/logrotate.d/nginx. Journald has its own limits set in /etc/systemd/journald.conf: SystemMaxUse=2G caps disk usage, MaxRetentionSec=1month deletes older entries automatically. For PM2, use the pm2-logrotate module to compress and rotate app logs weekly. On a modest 40 GB NVMe UK VPS this discipline keeps free space above 60% under normal load, so the file system never becomes the bottleneck on UK Speed NVMe VPS.
Best Practices for Structured Logging in Node.js and WordPress
Unstructured plain-text logs are hard to query at scale. In 2026, every serious UK VPS application emits JSON-formatted logs so machines can parse them: Pino for Node.js, Monolog with a JSON formatter for WordPress, and the built-in journalctl -o json mode for systemd services. A structured log line carries fields like level, timestamp, service, request_id, and duration_ms as separate keys. This lets you filter with jq at the shell (journalctl -o json | jq 'select(.duration_ms > 500)') or in Loki with LogQL. The upgrade takes one library swap in Node.js and a plugin in WordPress but pays back on every incident by turning grep archaeology into precise queries.
Centralized Log Management for Multi-VPS Setups
When you run more than three UK VPS instances, ssh-and-grep stops scaling. Set up a lightweight central log aggregator: Loki (Grafana’s log store) receives structured logs from Promtail agents on each VPS, and Grafana renders live searches across every host. An alternative for small teams is Vector plus SQLite or a hosted service. Whichever stack you pick, the key discipline is uniform tagging — host, app, env labels on every message — so a single query like {app="wordpress"} |= "500" pulls every 5xx across every VPS, not just the one you happened to SSH into. This pattern is essential when running WordPress alongside a full Docker Compose stack on a UK VPS.
Monitoring UK VPS Logs with Prometheus and Alertmanager
Reading server logs reactively is useful; alerting on patterns is transformative. Use promtail with LogQL rules to detect surge patterns — 100+ 5xx responses in 60 seconds, repeated database connection failures, or SSH brute-force from a single IP. Feed matches into Alertmanager and route pages to Slack, PagerDuty, or email. This closes the loop: logs are no longer archaeology after a downtime, but the earliest indicator that something is about to break. Combine with Fail2ban for automatic response to abuse patterns detected in logs.
Common Patterns When You Read Server Logs to Diagnose Issues
Six patterns solve 80% of production incidents on UK VPS: (1) OOM killed in dmesg means increase RAM or tune process memory limits; (2) NGINX upstream timed out means slow PHP-FPM — check pool max_children; (3) systemd start-limit-hit means increase StartLimitBurst and inspect the underlying crash; (4) MySQL too many connections means raise max_connections or add persistent connection pooling; (5) SSL renewal failure means Certbot cannot bind port 80 — a reverse-proxy conflict; (6) disk full means log rotation stopped working. For deeper reference, see the official journalctl manual.
Conclusion: Read Server Logs to Turn UK VPS Downtime into Uptime
Server logs on UK VPS are not archaeology — they are the earliest, cheapest, and most reliable signal that production is drifting toward failure. Master journalctl, tail NGINX and PM2 logs proactively, add rotation and centralized aggregation, and every incident becomes a five-minute diagnosis instead of a two-hour war room. UK Speed VPS with NVMe storage keeps log indexing fast enough that even weeks of history query instantly.